

Almost one in four UK adults said they felt lonely often, always, or some of the time in the latest ONS Opinions and Lifestyle Survey. A further many reported feeling lonely occasionally, and nearly half said they hardly ever or never feel this way. That single figure sits at the heart of every loneliness debate in the UK right now, from GP waiting rooms to Westminster select committees.
At a glance: 23% of UK adults feel lonely often, always, or some of the time. 27% feel it occasionally. 48% hardly ever or never do.
The breakdown matters as much as the headline:
- Many feel lonely often, always, or some of the time
- Many feel lonely occasionally
- Many hardly ever or never feel lonely
These figures come from the ONS Opinions and Lifestyle Survey (OPN), the government's most frequently updated direct measure. The Community and Engagement Survey and the Health Survey for England each measure loneliness slightly differently, which is why you'll see different percentages quoted across news reports.
Key Takeaways
UK loneliness affects around 23% of adults often, always, or some of the time, with younger adults now more affected than older generations, and rates have stabilised since 2021.
| Point | Details |
|---|---|
| Headline rate varies by survey | ONS OPN reports 23% lonely often/always/some of the time; Community and Engagement Survey reports 7% direct, 9% indirect. |
| Age pattern has reversed | Adults aged 18 to 29 now report higher loneliness than older generations, driven by time-use and work pattern shifts. |
| Local variation exceeds national trend | Some local authorities report loneliness rates around 13%, compared with roughly 2% elsewhere. |
| Health impact is significant | Often-lonely adults face more than double the odds of new-onset depression compared with rarely lonely adults. |
| Support exists for isolated relatives | DBS-checked companionship visits can address welfare checks and regular social contact for people living alone. |
Table of Contents
- National prevalence and loneliness trends across UK surveys
- Who is most affected by loneliness in the UK?
- How do surveys actually measure loneliness?
- What drives loneliness in the UK?
- How does loneliness affect health and wellbeing?
- Where to find and cite the original loneliness datasets
- What do these statistics mean for policy and services?
- How in-home companionship addresses the gaps in the data
- Loneliness in workplace settings and its effects
- How do UK loneliness rates compare with other countries?
- What are the UK's main loneliness initiatives doing?
- How should you weigh these numbers?
- Frequently asked questions
- Sources
National prevalence and loneliness trends across UK surveys
Three main data sources track loneliness in Britain, and they don't always agree, which trips up a lot of people quoting these statistics for the first time.
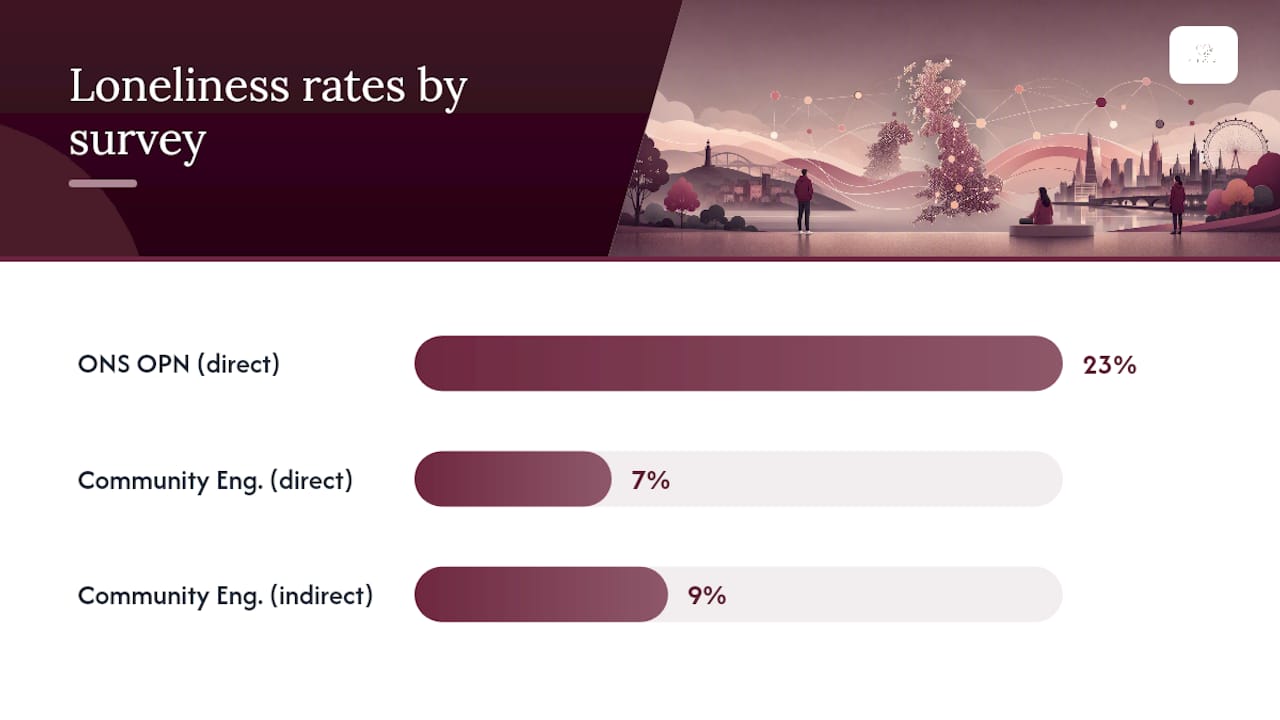
The ONS OPN survey puts the "often, always, or some of the time" figure at a sizable proportion for its latest period. The Community and Engagement Survey 2025/26, which asks a differently worded question and covers a full year rather than a monthly snapshot, reports just 7% of people aged 16 and over feeling lonely often or always. It also captures a separate measure, high indirect loneliness, affecting 9% of respondents. Neither number is wrong. They're measuring different things with different instruments, and conflating them is one of the most common mistakes in secondary reporting on this topic.
Here's how the three main sources compare:
| Survey | Measure | Headline rate | Latest release |
|---|---|---|---|
| ONS OPN | Direct question, often/always/some of the time | 23% | January 2026 |
| Community and Engagement Survey | Direct, often or always | 7% | 2025/26 |
| Community and Engagement Survey | Indirect composite (score 8–9) | 9% | 2025/26 |
| Health Survey for England | Age and wellbeing breakdowns | Varies by wave | NHS Digital release |
The trend story is more settled than the headline numbers suggest. Loneliness spiked sharply during the pandemic years, as you'd expect given lockdowns and restricted social contact. Since early 2021, though, rates have largely stabilised, moving within a narrow band year to year rather than climbing or falling dramatically.
A few patterns stand out across the survey series:
- The pandemic-era spike has not persisted; rates settled back within a few percentage points of pre-2020 levels.
- Year-on-year variance since 2021 tends to be small, usually a percentage point or two, rather than a clear directional trend.
- Seasonal dips appear in some monthly OPN data, with loneliness often reported slightly higher in winter months.
- Local and demographic variation is far larger than the national year-to-year change, which is where the real story lies.
If you're citing these figures for research or policy work, always name the survey alongside the percentage. "23% of UK adults are lonely" without attribution invites confusion the moment someone checks the Community and Engagement Survey and sees 7%.
Who is most affected by loneliness in the UK?
The most striking shift in UK loneliness data over the past decade is the age reversal. Loneliness used to be framed almost entirely as a problem of old age. It isn't any more.
Younger adults now report higher loneliness than older generations. Resolution Foundation analysis found that 18 to 29 year olds have seen a sharp rise in time spent alone, with young men now spending a large portion of their waking hours alone, up substantially from 2014/15 levels. That's a rise driven by changes in work patterns, more solo remote work, and shifts in how young people socialise, rather than any single dramatic event.

Older adults are not off the hook, though the picture is more nuanced than headlines suggest. Age UK's analysis, drawing on Understanding Society data, estimates that around 7% of people aged 65 and over, roughly 940,000 people, are often lonely. That's a meaningful number of people, but it's lower than the rate reported among the youngest working-age adults, a fact that surprises most people encountering it for the first time.
Beyond age, several other factors shape who experiences loneliness most acutely:
- Sex: Differences between men and women are generally modest in national surveys, though men are less likely to report loneliness directly even when indirect composite scores suggest otherwise.
- Region and local authority: Variation here dwarfs the national trend. The Community and Engagement Survey shows some local authorities reporting rates two to three times higher than others, with areas like Oldham reporting around 13% often or always lonely compared with roughly 2% in the City of London.
- Deprivation: Loneliness correlates strongly with local deprivation scores, though the relationship isn't purely about income; social infrastructure and housing density play a role too.
- Ethnicity: Some ethnic minority groups report higher indirect loneliness scores, though direct comparisons are complicated by smaller sample sizes in national surveys.
- Sexual orientation: Bisexual adults and those identifying with other minority sexual orientations tend to report higher loneliness than heterosexual respondents in several UK datasets.
- Employment and income: Unemployed people and those on lower incomes consistently report higher chronic loneliness.
| Group | Loneliness signal | Notable detail |
|---|---|---|
| Adults 18–29 | Sharpest rise in loneliness and time alone | Young men over two-fifths of waking hours alone |
| Adults 65+ | Roughly 7% often lonely | Around 940,000 people, per Age UK analysis |
| High-deprivation local authorities | Up to 13% often/always lonely | Compared with around 2% in some low-deprivation areas |
| Bisexual and other sexual orientation groups | Elevated indirect loneliness | Consistent across several national surveys |
The practical takeaway for anyone using these figures in research or service planning: age alone is a poor predictor. Living situation, local deprivation, and health status carry as much or more weight.
How do surveys actually measure loneliness?
Understanding measurement differences isn't a technical footnote, it's the difference between citing a figure correctly and misquoting it in a report someone else will rely on.
The ONS OPN survey asks a direct question: how often do you feel lonely, with response options ranging from "often or always" through to "hardly ever or never". It's simple, quick to administer monthly, and good for tracking short-term movement.
The Community and Engagement Survey uses both a direct question and an indirect composite score, built from a set of questions about companionship, feeling left out, and feeling isolated, scored from 3 to 9. A score of 8 or 9 counts as "high indirect loneliness". This method can pick up loneliness that people are reluctant to admit to directly, which is partly why the indirect figure (9%) sits above the direct figure (7%) in the same survey.
A person can score low on the direct question, "I don't feel lonely," and still score high on the indirect composite, because they answer "hardly ever" to feeling in tune with people around them. That gap is not a flaw in the data. It's the entire reason indirect measures exist.
Sample frames and collection windows differ too. OPN runs monthly telephone or online panels; the Community and Engagement Survey is a large annual face-to-face survey. Small discrepancies between releases are expected and don't indicate a real change in underlying loneliness.
When citing sources, be specific: "ONS OPN, January 2026" or "Community and Engagement Survey 2025/26, indirect measure" rather than a bare percentage.
What drives loneliness in the UK?
The evidence base here is unusually consistent across different datasets. GOV.UK analysis of Understanding Society and Community Life Survey data identifies a fairly stable set of predictors for chronic loneliness:
- Young age, particularly 16 to 34
- Living alone
- Low household income
- Disability or long-term health conditions
- Unemployment
- Recent house moves or disrupted local ties
None of these factors work in isolation. A young adult on a low income who has recently moved to a new city for work carries several risk factors at once, and that intersection is where chronic loneliness tends to take hold rather than resolve on its own. LGBT+ people, particularly bisexual adults, and people in the most deprived local authorities show similarly compounded risk when multiple factors overlap.
Pro Tip: If you're designing or commissioning a service, target the transition points, house moves, job loss, retirement, bereavement, rather than waiting for someone to self-identify as chronically lonely. By the time someone reports being "often" lonely on a survey, the pattern is usually already well established.
How does loneliness affect health and wellbeing?
The numbers above aren't abstract. Persistent loneliness has a measurable relationship with mental health outcomes, and the evidence has become considerably stronger in recent years.
A systematic review and meta-analysis found that adults who are often lonely have more than double the adjusted odds of developing new-onset depression compared with those who are not often lonely, a pooled adjusted odds ratio of roughly 2.33. That's a substantial signal, though it comes with the usual caveats of pooled longitudinal data: heterogeneity between studies and the likelihood that loneliness and poor mental health reinforce each other in both directions.
Key figure: Adults who are often lonely face more than double the odds of new-onset depression compared with those who rarely or never feel lonely.
The Mental Health Foundation describes chronic loneliness as a significant public health concern in its own right, closely tied to stigma and to poor mental health more broadly, and notes the relationship runs both ways rather than loneliness simply causing distress in one direction.
Beyond mental health, chronic loneliness carries knock-on costs: increased pressure on GP services and social care, lower reported life satisfaction, and productivity effects in workplaces where isolated employees disengage or take more sick leave. None of these are easily quantified nationally, but they follow logically from the mental health evidence and from what social care providers report anecdotally.
Where to find and cite the original loneliness datasets
If you're writing a report, dissertation, or policy brief, cite the primary source rather than a secondary write-up wherever possible.
- ONS OPN bulletin and dataset: best for timely, monthly snapshots of direct loneliness prevalence. Cite as "Office for National Statistics, Opinions and Lifestyle Survey, Public opinions and social trends, Great Britain: January 2026".
- Community and Engagement Survey loneliness report: best for the indirect composite score and for local authority breakdowns. Cite as "Community and Engagement Survey 2025/26 – loneliness report, GOV.UK".
- Health Survey for England / NHS Digital: best for combining loneliness with detailed health and wellbeing variables. See the Loneliness and wellbeing chapter.
What do these statistics mean for policy and services?
The data points fairly clearly to where resources should go. Young adults, particularly those living alone on low incomes, now carry as much or more loneliness risk as older people, which challenges service models still built almost entirely around elderly outreach.
Practical priorities that follow from the evidence:
- Target outreach at deprived local authorities identified in Community and Engagement Survey data, rather than applying a uniform national approach.
- Build workplace wellbeing initiatives that address isolation among remote and solo workers, not just traditional office culture.
- Support earlier detection in primary care, since GPs are often the first point of contact for someone whose loneliness has already become chronic.
- Extend local authority targeting using small-area data, since national percentages mask large local swings.
- Track unpaid carers specifically; they face compounded isolation risk that broader surveys can underrepresent.
Monitoring needs to happen at least annually against OPN and Community and Engagement Survey releases, with local authorities watching their own small-area figures more frequently where resources allow. A single national percentage, however accurate, tells commissioners very little about which ward or postcode needs support first.
How in-home companionship addresses the gaps in the data
The statistics above point squarely at a group who don't always show up loudly in national headlines: people living alone, often older adults or those with limited mobility, who go days without meaningful conversation. That's precisely the gap Fromlovewithcare was built to close.
Fromlovewithcare provides in-home companionship visits, including conversation, shared activities, grocery shopping support, accompaniment to appointments, and welfare check-ins. Every companion is DBS-checked and trained, though the service is explicitly non-medical; it does not replace personal or clinical care.
A relative living two hours away can't always tell whether their mother has spoken to anyone since Tuesday. A regular companionship visit, and the welfare check that comes with it, closes exactly that gap.
Older adults living alone, people recovering from illness with reduced mobility, and family members seeking reassurance through welfare checks tend to benefit most from this kind of regular contact. Families researching options for a lonely relative can read more on Fromlovewithcare's loneliness support services page.
Loneliness in workplace settings and its effects
Workplace loneliness rarely appears in headline UK statistics, but it sits underneath several of the trends already discussed. Remote and hybrid work, now standard across large parts of the UK economy, has reduced casual daily contact for millions of employees, and that shift maps directly onto the Resolution Foundation's finding that young adults, disproportionately represented in remote-friendly roles, now spend far more of their waking hours alone than a decade ago.
Isolated employees report lower job satisfaction and are more likely to disengage quietly rather than raise concerns, which makes workplace loneliness harder for managers to spot than more visible wellbeing issues. It also compounds existing risk factors: someone who lives alone and works alone has effectively removed two of the main sources of daily human contact from their routine at once.
Employers increasingly treat this as a wellbeing metric worth tracking, alongside sickness absence and engagement scores, though standardised national workplace loneliness data remains thinner than the general population surveys covered elsewhere in this article. For now, the clearest signal comes from combining what we know about time-use shifts among younger workers with the broader loneliness and mental health evidence: isolated work patterns and isolated home lives tend to reinforce each other rather than offset one another.
How do UK loneliness rates compare with other countries?
The UK doesn't stand out as uniquely lonely when set against other high-income nations, though direct comparisons are tricky because countries measure loneliness with different survey instruments, much like the divergence between the ONS OPN and Community and Engagement Survey figures within the UK itself.
What does travel consistently across international comparisons is the age pattern. Several European countries have reported similar shifts toward higher loneliness among younger adults relative to older generations, a pattern researchers link to comparable changes in remote work, urban living costs, and digital-first socialising rather than anything uniquely British.
The UK's relatively strong tradition of dedicated loneliness research, including a government-appointed Minister for Loneliness since 2018, means the country has more granular, frequently updated data than many comparable nations. That's a data availability difference as much as a prevalence difference. Countries without an equivalent to the OPN or Community and Engagement Survey simply have less visibility into whether their populations are more or less lonely than Britain's, which makes bold international rankings on this topic less reliable than they first appear.
What are the UK's main loneliness initiatives doing?
The UK has invested more formally in tackling loneliness than most comparable countries, starting with the world's first dedicated government strategy on the issue in 2018 and the ongoing role of a Minister for Loneliness.
The Campaign to End Loneliness, a charity coalition, has pushed for better local authority data use, encouraging councils to act on the kind of small-area variation highlighted in the Community and Engagement Survey rather than treating loneliness as a purely national issue. The Mental Health Foundation contributes ongoing research linking loneliness interventions to measurable mental health outcomes, reinforcing that early, low-cost social support tends to outperform crisis-stage intervention.
Local authority-level schemes vary widely in scale and funding, from social prescribing programmes that connect GPs to community groups, to targeted outreach in the highest-deprivation wards flagged by national survey data. Robust, standardised impact figures across all these schemes remain limited; loneliness interventions are notoriously hard to evaluate at scale because effects show up gradually and unevenly across different groups. What's clearer is the direction of travel: government and charity efforts increasingly align with what the data shows, focusing on younger adults and deprived areas rather than defaulting to an elderly-only framing.
How should you weigh these numbers?
The most reliable signal in this data isn't any single percentage, it's the age shift and the post-2021 stability. Both patterns hold up across multiple independent surveys, which gives them more weight than a headline figure from one release alone. Where I'd urge caution is treating direct and indirect measures as interchangeable; they answer different questions. Use these figures for policy targeting and service planning, but always name your source.
Frequently asked questions
What percentage of UK adults feel lonely? Around 23% of UK adults report feeling lonely often, always, or some of the time, according to the ONS OPN survey. The Community and Engagement Survey reports a lower direct figure of 7%, using a differently worded question.
How many elderly people are lonely in the UK? That's lower than the rate reported among adults aged 18 to 29.
Has loneliness in the UK increased since the pandemic? Loneliness spiked during the pandemic but has largely stabilised since early 2021, with year-to-year variation typically within a percentage point or two on the main surveys.
Are young people lonelier than older people in the UK? Yes. Analysis from the Resolution Foundation shows adults aged 18 to 29 now report higher loneliness than older generations, with young men spending more than two-fifths of their waking hours alone.
What's the difference between direct and indirect loneliness measures? Direct measures ask people outright how often they feel lonely. Indirect measures use a composite score built from questions about companionship and feeling left out, which can capture loneliness people are reluctant to name directly.
Can a companionship service help with loneliness statistics locally? Regular in-home visits from a vetted companion, such as those offered through Fromlovewithcare's services, can provide consistent social contact for people identified as at risk in local authority loneliness data, particularly older adults living alone.
This article is general information, not a substitute for advice from a qualified doctor. Consult a qualified healthcare professional about your own circumstances before acting on anything here.
Sources
- Public opinions and social trends, Great Britain: January 2026
- Community and Engagement Survey 2025/26 - loneliness report
- All by myself • Resolution Foundation
- Loneliness and mental health report - UK | Mental Health Foundation
- Loneliness and the onset of new mental health problems in the general population